DSPORT Issue #241
By Allan Lockheed
Continued from Learning Curves Revisited | Are You Running the Right Curve?
Dyno graphs don’t race. However, dyno charts can provide the roadmap to go faster than the competition. By understanding how peak horsepower, the powerband, area under the horsepower curve and the actual shape of the power curve affect performance, the engine can be tuned to produce a curve that is optimized for drag, circuit, drift or street performance.
PEAK HORSEPOWER
Peak horsepower numbers are great for bragging, but they can be misleading when used alone to compare the performance potential from two different engines. To say that peak horsepower numbers are useless is an overstatement. The peak horsepower number quantifies the horsepower being produced at a specific engine speed (RPM). If your vehicle was set up with a transmission that allowed the engine to stay at this exact engine speed while accelerating from zero to top-speed, peak horsepower would be all the information needed from the dyno session. In reality, an engine must produce respectable power across a band of engine speeds.
PEAK HORSEPOWER represents the horsepower at just one engine speed. As such it doesn’t tell the entire story of an engine’s performance potential.
THE POWERBAND
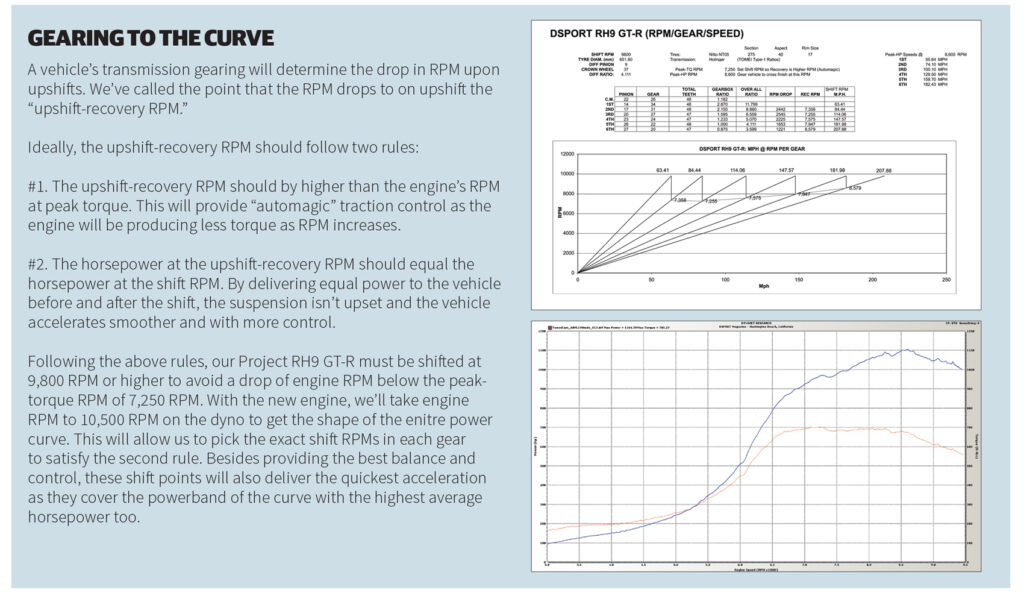
Considering an engine needs to work across a range of engine speeds, it’s important to establish where the desired powerband will be for a particular vehicle setup. The gearing in the transmission along with the peak operational engine speed (redline RPM of the engine) can help to establish the ideal powerband for the vehicle. Assuming shifts are made at redline, it is possible to calculate the engine speed when upshifts are made if the transmission ratios are known. If the transmission gearing is setup in a vehicle to cause the engine speed to drop from 7,500 to 5,000 RPM, then this range needs to be considered within the desired powerband of the engine. Be sure to look at every gear change RPM drop, as they will vary from gear to gear. The largest drop usually occurs between First and Second on most factory transmissions. As you may already know, close-ratio transmissions are geared to provide smaller engine speed drops between gears. This makes the challenge of producing good power across the powerband easier, as the powerband will need to cover a shorter range of RPM.
Based on transmission gearing and the dyno power curve, one can calculate the range of RPMs that the engine will allow the vehicle to accelerate quickest for each gear.
AREA UNDER THE CURVE
Chances are that you’ve heard the term “area under the curve.” The area under the curve simply refers to the size of the region below the dyno curve. As you may have already guessed, the most important portion of the area under the curve is between the start and end point of the powerband. It’s entirely possible for one engine with lower peak horsepower to outperform another engine with higher peak horsepower when the area under the curve over the powerband is higher in the lower-peak-horsepower engine.
AREA UNDER THE CURVE in the powerband is key.
GETTING IN SHAPE
A good percentage of the very-best engineers, race car buliders and engine tuners understand and use dyno graphs as outlined to improve a
vehicle’s performance. However, there are a select few racecar and engine tuners that focus on the shape of the dyno curve to optimize controllability, traction and suspension stability. Why should this be important to you? When you shift gears and it upsets tire grip, you get passed–if you are lucky. If unluckly, the loss of traction can result in a crash. Likewise, when you feed in throttle to launch your drag car or attempt to accelerate off a corner only to spin the tires, the finish line just got a lot closer, for the competition that just passed you. As the sample dyno charts will demonstrate, the shape and length of the power curve beyond peak horsepower plays a significant roll.
SHAPE AND LENGTH of power curve beyond peak horsepower RPM is crucial.
“AUTOMAGIC” TRACTION CONTROL
The previous Formula GP road race motorcycles weighed about 250 pounds, produced almost 200 HP, and had about 20 square inches of tire contact patch. So, when many-time Honda World Champion Mick Doohan said he never raced at engine RPMs below peak torque, it was time to listen.
After the peak torque RPM, torque falls off as engine RPM increases. When the tire breaks at engines speeds above the peak torque RPM, engine speed increases and torque at the contact patch decreases. With less torque at the contact patch, the tire grips again. By racing at engine RPMs beyond the peak torque RPM, you race forward instead of feeling silly behind a cloud of tire smoke. It’s “automagic” traction control.
Always race an engine between the RPM at peak torque and redline for max controllability.
In contrast, when a tire breaks loose with the engine accelerating from an RPM below peak torque, it won’t recover grip until much later. The engine must rev past peak torque and fall off the other side to reduce the torque to a point where the tire grips again. By then the driver has usually spun out, crashed, or vanished in tire smoke. Especially when accelerating out of a corner, the driver with a rising torque curve cannot put as much throttle down as the driver whose falling engine torque curve catches small slips without spinning out.
"Automagic” traction control occurs when you keep engine revs beyond peak torque. Torque is reduced as RPM increases.
FALLING TORQUE CURVE, RISING HORSEPOWER
Horsepower usually increases after peak torque RPM on most engines. This occurs because RPM increases faster than torque falls. In all cases, the fastest lap times result when you put the most horsepower (not torque) on the track. This is one reason friendly power and torque curves, when properly driven, give you faster, easier and more boring laps, as the car becomes easier to control.
SMOOTH SHIFT RECOVERY
A few years back, the Pro Modified drag racers pointed out to me that if you could hear, feel, or see the shift from First to Second, it was going be a slow pass. Mike Hedgecock of Eagle Racing Engines builds 2,000-plus-horsepower engines for 2,400-pound RWD Pro-Mod door-slammers. These cars run the quarter mile in the low 6’s or high 5’s. These racers understand that tire grip must not be upset when a vehicle is already on the ragged edge of traction. To avoid an upset to grip, acceleration before and after the shift must be EXACTLY the same. This occurs when the horsepower at the shift RPM equals the horsepower at the engine RPM after the shift; the same horsepower to the tires before and after the shift. Optimizing the shape of the power curve, transmission gearing and shift points allows the vehicle to put down maximum power without upsetting traction.
THE DRIFT ENGINE EXCEPTION
In setting up an engine for drift competition, the driver wants a power curve void of “automagic” traction control. Instead, a power curve that induces and carries wheelspin is desirable. One way to acomplish this is to race at engine speeds below peak torque. The swap to a larger-displacement, high-torque V8 engine can often provide enough torque at lower engine speeds below peak torque to get the tires spinning. As the engine speed is increased toward the peak torque RPM, the chances of recovering traction are eliminated. The addition of a centrifugal supercharger that adds boost as engine speed increases can also provide these drift-car optimized curves. Longer-duration camshafts can also be used to shift the peak torque RPM to a higher level. Of course, these setting are specialized only for dedicated drift vehicles and should not be used on competition or street-driven vehicles.
THE BOTTOM LINE
By understanding your engine’s power curve, you can make informed decisions about future upgrades while developing a friendly power curve to race smooth and fast. With increased control of the engine’s power, passes and laps may be a bit more boring, but you will be quicker.
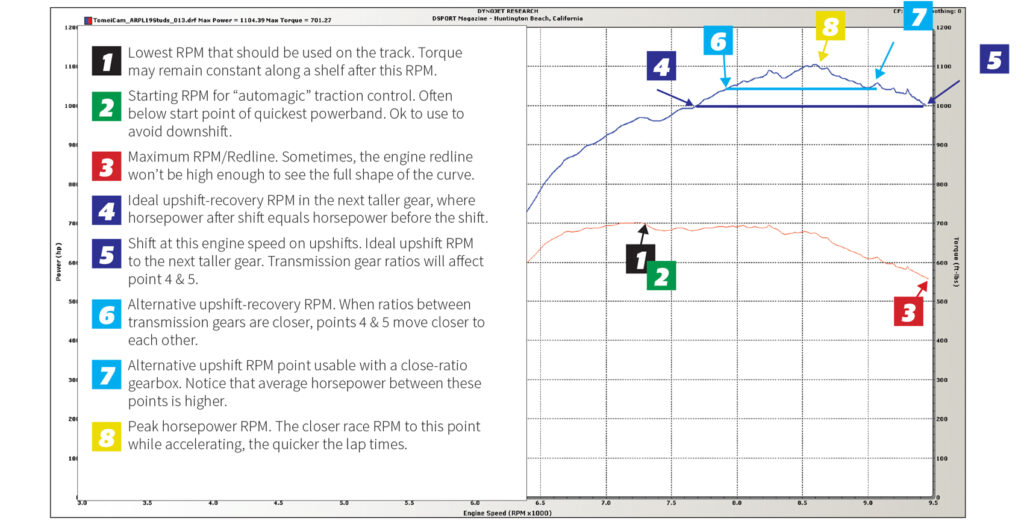
Dyno Curve Key Points
ABOUT THE AUTHOR: ALLAN LOCKHEED
Allan Lockheed Jr. is the son of aviation pioneer Allan Lockheed [Loughead]. His uncles Malcolm and Victor invented hydraulic brakes and co-founded the SAE, respectively. Allan holds a degree in engineering with studies in math and systems analysis. In 1987, Allan wrote the first engine design software for fellow engine addicts, The ENGINE EXPERT(TM). Today, EE is distributed by AUDIE TECHNOLOGY and used worldwide by top engine builders. Allan has consulted on hundreds of successful engine development projects using EE, his proprietary software, and DynoMation tools. Allan focuses on integrating cylinder head design, intake systems, exhaust systems, and valve events for specific powerband requirements, Allan has assisted with engine development in all forms of 4-stroke engines; including cars, motorcycles, aircraft, and boats.
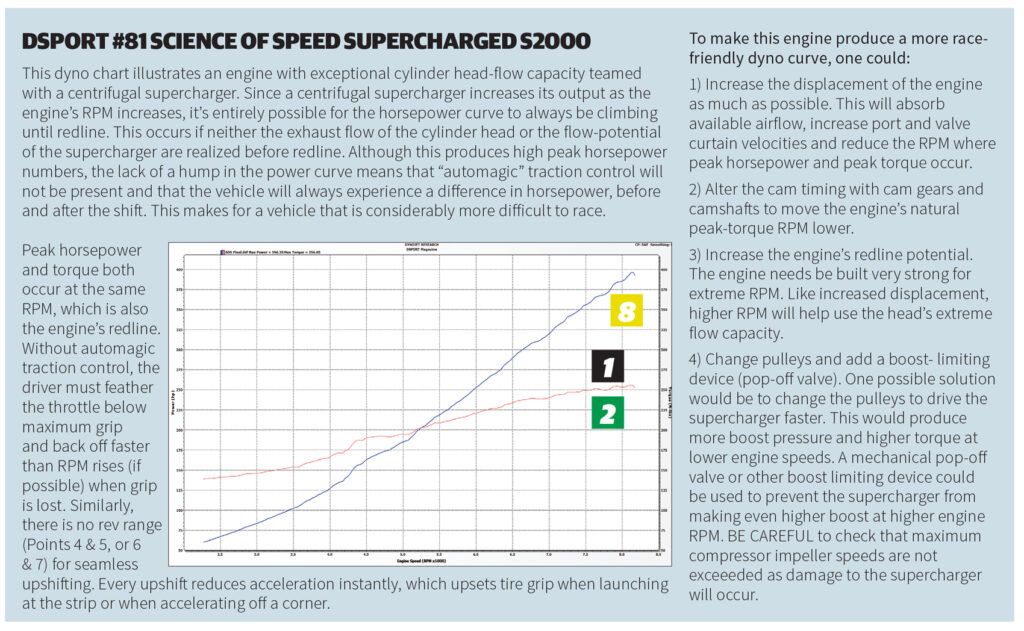
DYNO CURVE EXAMPLES
World Rally Competition demands maximum acceleration and tire grip on all surfaces, including mud holes, snow, ice and perfectly-dry pavement. Not surprisingly, some of the best examples of race-friendly dyno curves are found with the Subaru WRX STI and Mitsubishi EVO X. Below are dyno graphs for a stock examples and tuned examples from Harman Motive. All four examples show easy race controllability when driven as they want to be driven.
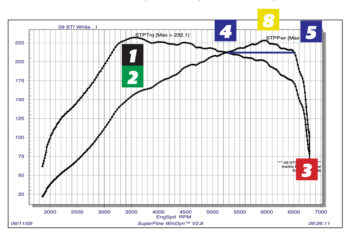
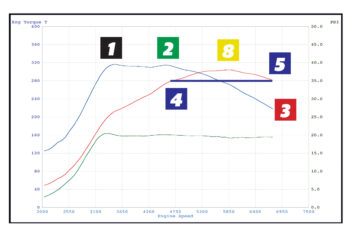
STOCK SUBARU WRX STI
Shows a phenomenally-wide “automagic” traction control range. Points 1 and 2 occur at the same low RPM, and torque drops off controllably to redline. There is a small penalty for this feature. Horsepower at low RPM is down, because at point 4 (the upshift recovery RPM), torque has fallen off a lot from peak. As a result, the powerband from 4 to 5 is fairly narrow, and the area under the horsepower curve from 4 to 5 could be bigger.
Based on only the weight and peak horsepower of these two cars, drag-strip performance should be identical (ET and MPH within a few hundredths). Instead, test results show advantage to the Mitsubishi power-band and 6-speed TC-SST gaining almost 0.3 sec and 2 MPH.
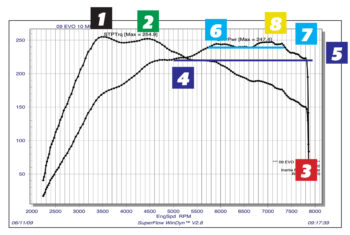
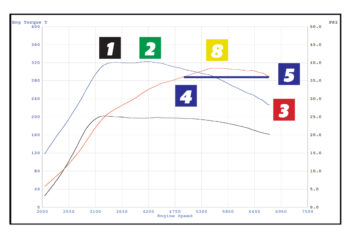
STOCK MITSUBISHI EVO X MR
The EVO X has a wide powerband from 4 to 5, with more area under the curve than the STI. The factory close-ratio gear set allows you to drive between points 6 and 7. Between 6 and 7, you put more horsepower on the track, can shift as necessary without upsetting tire grip, and increase engine durability by reduced peak RPM (point 7 verus point 5).Pretty neat, but there is no free lunch. All the above happens thanks to a secondary torque peak at point 2. Since there is a saddle shape between 1 and 2, it might be tricky to drive when accelerating off a corner or launching on the drag strip in this RPM range. However, “automagic” traction control is very friendly between 2 and 3 because it falls off even faster than the STI’s curve.
Based on the curves, the stock EVO X driver should: 1) Keep RPM between points 6 and 7 wherever possible. 2) Use RPM between points 4 and 5 when necessary. 3) Never accelerate at WOT below RPM at Point 2.
Harman Motive Tuned Subaru WRX STI
Now, let’s look into Harman Motive’s 2008 Subaru STI and Mitsu EVO X. Dan Harman upgraded the performance of both engines to nearly identical levels, and added point 2, the secondary torque peak into the STI power band. Harman’s STI torque curve has a little saddle between point 1 and 2, but it is so small that the driver’s control should not be challenged. Harman Motive also put point 2 and point 4 at the same RPM, which widens the rev range between shift points to almost 2,000 RPM and achieves excellent “automagic” traction control throughout that range.
Harman Motive Tuned Mitsubishi EVO X MR
Harman Motive’s EVO X torque curve places the secondary torque peak (2) closer to the primary peak (1), with no saddle between. The result is a narrower rev range between shift points, about 1,600 RPM, with a 200- to-300 RPM wider range of “automagic” traction control. The differences are small enough that driver skill makes greater difference than engine power, torque or power band.
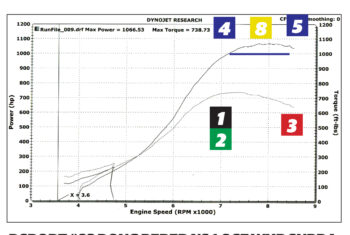
DSPORT #83 DOUG PERERA’S 1,067 WHP SUPRA
This awesome, 3.4-liter Supra has “automagic” traction control after points 1 and 2 at 7,200 RPM. However, the powerband is only 1,300 RPM wide. Dyno testing should be extended from 8,500 to 9,000 RPM, to find the shape of HP and torque curves on overrun. Of course, the engine must have been built properly to not encounter breakage at 9,000 RPM.
The ideal upshift recovery RPM (point 4) is also 7,200 RPM. The problem is that this point 4 is just 1,300 RPM away from point 5. With a close-ratio six speed, the RPM drop between gears is likely to be at least 2,000 RPM. This means that the actual upshift recovery RPM will be below 7,000 RPM. This means no “automagic” traction control on gear shifts. To remedy this, the next phase of engine development should focus on shifting peak torque down to 6,500~6,800 RPM, while building the engine to rev to 9,000 RPM.
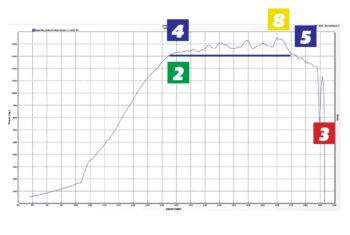
DSPORT #84 1,450 WHP MAJESTIC SUPRA
This dyno graph does not show torque, nor RPM. So, it is not very useful for race planning. However, the curve does reveal a remarkably flat HP shelf which must extend across 1,800 or 1,900 RPM. Horsepower is almost constant from 135 to 175 MPH. Therefore torque must fall off at the same rate as RPM increases in this range. From this, we know two things:
1) There is “automagic” traction control across the race rev range.
2) The driver can upshift or downshift anywhere in the race rev range
without upsetting tire grip very much.
The bottom line is that this is a remarkable power curve, easy and forgiving to drive smooth and fast.