
Which Sensors And Where To Put Them
Of equal importance on deciding what engine and system items you will be monitoring is the appropriate placement and installation of the sensors that come with them. For example, an oxygen sensor for an A/F gauge will not provide the same reading when installed in the exhaust stream before the catalytic converter as it would if installed after the catalytic converter. Furthermore, placing the O2 sensor in a manifold runner will give you accurate readings for the cylinder that corresponds with that runner, but won’t give you an accurate reading of the overall A/F ratios. Similarly, an exhaust gas temperature probe placed too far downstream in the exhaust system will yield lower, inaccurate temperatures as the exhaust gas has had too much time to cool down. Remember, with improper installation or sensor placement, the information you gather is essentially useless.
Splitting the Difference
For an even clearer picture of engine and component performance, gauges can be set up to show differential readings of common inputs. For example, air charge temperature gauges can be installed in the charge piping before and after the intercooler core to test intercooler efficiency. The same differential readings can be applied to fluid pump system lines and coolers to measure their efficiency and effectiveness as well.
In multi-channel datalogging systems, splitting the channels to read opposing or individual components of a system can be used to identify failing components but can also give a driver, tuner or chassis engineer insight into the driver’s habits. For example, analyzing brake pressure can help a driver identify the fastest way around a track by deciphering where unnecessary or excessive brake force was applied.
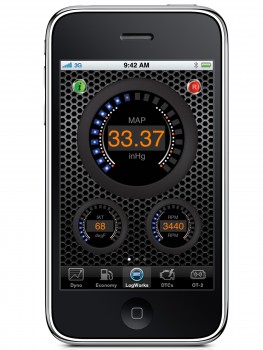
By plugging into the OBDII port, data can also be monitored on user interactive displays. Innovate Motorsports offers a wireless OBDII module that links to your iPhone/iPod, adding datalogging, virtual dyno and Scan Tool capabilities.
You Say You Want a Resolution
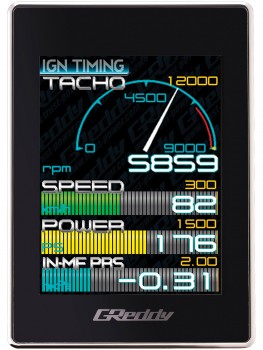
 For both simple gauge display and data-logging, it’s essential to have an adequate level of precision or sample frequency. For example, if your turbocharged-engine is expected to boost 15 psi, a gauge that reads -30 in Hg–to-30 psi would be more apt than one that reads 0-40 psi. Similarly, a 12,000-rpm tachometer might draw attention but would be completely useless for an engine that redlines at 6,800 RPM.
In the case of data acquisition systems, the sampling frequency should be appropriate to the parameter being measured. Datalogging speed is determined in hertz (hz) or cycles per second. So, a parameter that’s logged at 20 Hz would register 20-times per second; another parameter logged at 1000 Hz or 1 kHz would register 1000-times per second. The greater the amount of data logged per second, the more useful the information is when its time to analyze it.
Depending on what parameter is being measured, there will be an ideal resolution or sample frequency. Since engine coolant temperature takes some time to register, sampling and logging engine temperatures at a rate faster than once per second would be a waste of data storage space and computational resources. Conversely, failure to record individual wheel speeds at a rate much faster than once per second would yield essentially useless data as the small variations recorded wouldn’t be able to provide any insight as to which wheel was spinning freely, indicating a loss of traction.
 Most factory ECUs are capable of only collecting the entire range of input sensors at a frequency lower than 60 Hz. This should make it obvious that real data analysis requires a equipment outside of what’s supplied by the OE engine/ECU manufacturer. For example, to adequately sample all knock events at a 9,000 RPM engine speed, the sample rate would have to be greater than 75 Hz, well outside factory parameters and into the realm of a true DAS. However, keep in mind that the DAS system you choose has to be able to perform at the required sample speed for all of its available channels in order to be of the most use.
Resolution is the other key variable that needs to be considered for the DAS system of choice. It may be unnecessary to record engine temperatures in fractions of degrees. However, a higher resolution is necessary when analyzing items that require more precision such as suspension position or travel.
Finally, keep in mind that the inclusion of a display for a true data acquisition usually results in an increase in price, a decrease in available storage memory or a decrease in processing speed. Ultimately, your budget and need will determine which system works best for you.
| PRIORITY LIST ALL-MOTOR | PRIORITY LIST FORCED-INDUCTION |
|---|---|
| 1. Tachometer | 1. Tachometer |
| 2. Oil Pressure | 2. Oil Pressure |
| 3. Engine Coolant Temp | 3. Engine Coolant Temp |
| 4. Fuel Pressure | 4. Boost Pressure |
| 5. A/F Ratio | 5. Fuel Pressure |
| 6. Exhaust Gas Temperature | 6. A/F Ratio |
| 7. Engine Oil Temperature | 7. Exhaust Gas Temperature |
| 8. Voltage Meter | 8. Engine Oil Temperature |
| 9. Vacuum Gauge | 9. Voltage Meter |
| 10. Manifold Air Temperature | 10. Manifold Air Temperature |